102,551 building/location groups
Explore the flood mapLondon / Property-linked finance
Analysis · 30 October 2026London’s retrofit
opportunity.
Explore the scale of building upgrades across London. Then look closer at the buildings in your portfolio.
Explore the London market51.5072° N 0.1276° W
Greater London33 boroughs / All asset sizes
Energy retrofit works scenario
£63.13–68.26bn
Financing scenario · Assumed 70% share
£44.19–47.78bn
London · EPC C–G · Conditional cost scenarios. Resilience and new construction are reported separately. MEES is included in retrofit.
01 / The London market
Find the opportunity.
Choose where to look.
Start with a borough or a building type. The figures show possible works spending at the chosen upgrade budgets.
London / Borough viewSelect a borough to look closer
£0£5.47bn
Colour shows the lower end of the energy works range. Labels show the full range.
Borough boundaries: OS Boundary-Line via GLA. © Crown copyright and database right 2018. Open Government Licence v3.0.
Energy works / By building type
A different mix
in every borough.
Solid bars show the lower estimate. Lighter ends show the range across three business-area overlap assumptions.
- Explore all seven building categories in the table below.
Largest London
energy scenarios
energy scenarios
Westminster£4.81–5.47bn
Tower Hamlets£3.06–3.41bn
Camden£2.74–3.18bn
See all 33 boroughs
London-wide energy works, all building types. MEES budgets are included. Leading types below use the 50% overlap case for ordering; no case is preferred.
| Borough | Energy works | MEES, included | Leading building types |
|---|---|---|---|
| Westminster | £4.81–5.47bn | £2.46bn | Offices · Retail / hospitality · Multi-family residential |
| Tower Hamlets | £3.06–3.41bn | £1.68bn | Offices · Multi-family residential · Retail / hospitality |
| Camden | £2.74–3.18bn | £1.17bn | Offices · Multi-family residential · Retail / hospitality |
| Ealing | £2.45–2.58bn | £587.75m | Warehouses / industrial · Single-family residential · Multi-family residential |
| Croydon | £2.43–2.58bn | £461.31m | Single-family residential · Multi-family residential · Retail / hospitality |
| City of London | £2.12–2.78bn | £1.65bn | Offices · Retail / hospitality · Other non-residential |
| Hillingdon | £2.19–2.47bn | £727.98m | Single-family residential · Warehouses / industrial · Offices |
| Southwark | £2.21–2.40bn | £571.31m | Multi-family residential · Offices · Single-family residential |
| Brent | £2.09–2.21bn | £464.43m | Multi-family residential · Single-family residential · Warehouses / industrial |
| Lambeth | £2.07–2.22bn | £315.44m | Multi-family residential · Single-family residential · Offices |
| Enfield | £2.05–2.16bn | £353.57m | Single-family residential · Multi-family residential · Warehouses / industrial |
| Barnet | £2.05–2.14bn | £261.32m | Single-family residential · Multi-family residential · Retail / hospitality |
| Islington | £1.94–2.14bn | £556.61m | Multi-family residential · Offices · Retail / hospitality |
| Bromley | £1.99–2.04bn | £179.15m | Single-family residential · Multi-family residential · Retail / hospitality |
| Hounslow | £1.93–2.08bn | £559.19m | Single-family residential · Multi-family residential · Offices |
| Wandsworth | £1.94–2.07bn | £263.18m | Multi-family residential · Single-family residential · Retail / hospitality |
| Hackney | £1.69–1.83bn | £252.72m | Multi-family residential · Offices · Retail / hospitality |
| Kensington and Chelsea | £1.69–1.78bn | £409.07m | Multi-family residential · Retail / hospitality · Offices |
| Newham | £1.66–1.76bn | £267.40m | Single-family residential · Multi-family residential · Retail / hospitality |
| Lewisham | £1.69–1.73bn | £132.17m | Multi-family residential · Single-family residential · Retail / hospitality |
| Hammersmith and Fulham | £1.63–1.82bn | £473.35m | Multi-family residential · Offices · Retail / hospitality |
| Havering | £1.61–1.66bn | £244.66m | Single-family residential · Retail / hospitality · Multi-family residential |
| Bexley | £1.56–1.63bn | £238.31m | Single-family residential · Warehouses / industrial · Multi-family residential |
| Haringey | £1.55–1.61bn | £156.31m | Multi-family residential · Single-family residential · Retail / hospitality |
| Redbridge | £1.54–1.58bn | £153.21m | Single-family residential · Multi-family residential · Retail / hospitality |
| Greenwich | £1.52–1.59bn | £219.18m | Single-family residential · Multi-family residential · Warehouses / industrial |
| Waltham Forest | £1.51–1.57bn | £143.10m | Single-family residential · Multi-family residential · Retail / hospitality |
| Merton | £1.35–1.43bn | £214.25m | Single-family residential · Multi-family residential · Warehouses / industrial |
| Barking and Dagenham | £1.28–1.36bn | £186.26m | Single-family residential · Warehouses / industrial · Multi-family residential |
| Harrow | £1.27–1.31bn | £138.85m | Single-family residential · Multi-family residential · Retail / hospitality |
| Richmond upon Thames | £1.27–1.29bn | £123.74m | Single-family residential · Multi-family residential · Retail / hospitality |
| Sutton | £1.19–1.25bn | £148.86m | Single-family residential · Multi-family residential · Retail / hospitality |
| Kingston upon Thames | £1.05–1.09bn | £147.57m | Single-family residential · Multi-family residential · Retail / hospitality |
See building quantities and budgets
London-wide modelled EPC C–G stock. Housing quantities count homes; business quantities measure floor area.
| Building type | Modelled C–G stock | Energy works |
|---|---|---|
| Multi-family residential | 1.74 million homes | £17.43bn |
| Single-family residential | 1.49 million homes | £14.92bn |
| Offices | 22.20–27.04 million m² | £11.90–14.49bn |
| Retail / hospitality | 15.38–17.26 million m² | £8.24–9.25bn |
| Warehouses / industrial | 10.41–11.62 million m² | £5.58–6.23bn |
| Other non-residential | 9.42–11.05 million m² | £5.05–5.92bn |
| Other residential | About 911 homes | £9.11m |
Other residential adds £9.11m. All seven categories are included in the retrofit total.
How the scenario range is calculated
Homes account for £32.36bn of works across 3.24 million modelled homes. Businesses account for £30.77–35.90bn across 57.41–66.97 million m².
Some business floor area cannot be linked to a known property. The model compares three assumptions about how much of that area overlaps known space: 0%, 50% and 100%. None is preferred.
All London · All building types
The three scenarios span £63.13–68.26bn in energy works.
Selected budgets are £10,000 per home and £500 per business m² in 2023 prices, adjusted to about £536/m² in 2026. The same packages applied to the recorded EPC population give £42.58bn.
These ranges vary the overlap assumption only. Stock coverage, transferred housing shares, estimated business areas and package costs add uncertainty. Some business groups have no usable area and remain unpriced.
Energy efficiency, heating and renewables share the retrofit budget; separate technology totals are not estimated. The 70% financing share is an assumption.
Within the retrofit total / MEES
A closer look at
large business space.
Minimum Energy Efficiency Standards, or MEES, are one reason to examine energy performance. This screen covers recorded EPC C–G business assessments over 1,000m².
£15.91bn
6,960 assessments · 29.69 million m²
Included in retrofit. Building-specific minimum compliance spending remains unestimated.
Energy package budgets
What these figures cover
The budget applies the chosen generic energy package to this assessment group. Assessments are not a count of distinct buildings. The screen does not establish a building’s legal obligations or minimum compliance cost.
BIT Record / Your building, in view
Capture once.
Build on the record.
Construction documentation, restoration and portfolio operations involve repeated work and specialist time. Missing information can add significant costs. One capture can serve several departments throughout a building’s life.
01 / DocumentConstruction
Construction
documentation.
Add properties and capture rooms on iPhone. Keep measurements, openings, photographs and review notes together for handovers and later work.
02 / Restore
Restoration.
Review the digital twin and saved room energy scenarios on Mac. Give specialists recorded evidence when scoping repairs and improvements.
03 / OperatePortfolio
Portfolio
operations.
Keep retrofit projects, supporting evidence, decision owners and next steps with each property. Reuse the record for maintenance and improvement reviews. Add evidence as the building changes.
Inside BIT Record
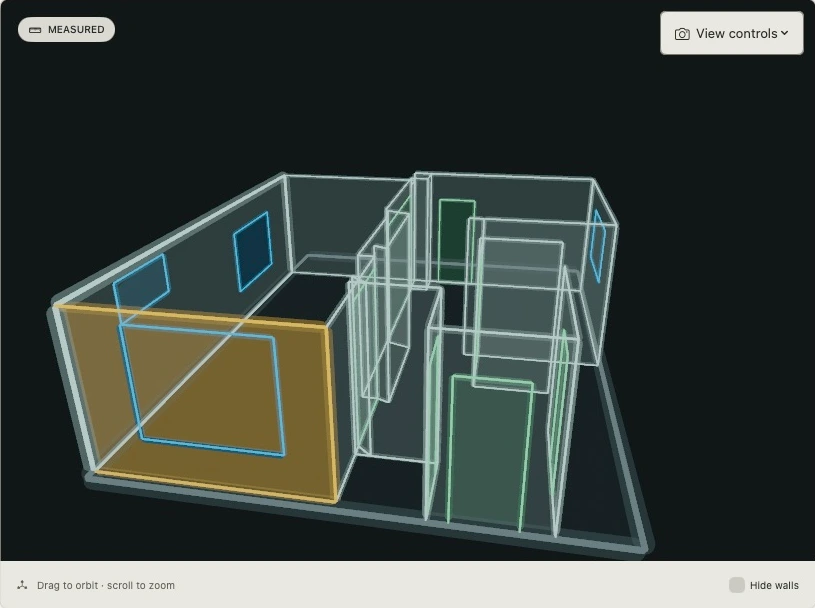
143 N View Rd
London N8 7ND, UK · Illustrative address
Room-capture data from another property. Screenshots retain the source record.
66.9m²Floor estimate4Windows4Doors
The space, togetherSee how the
See how the
room fits together.
The captured model connects walls, openings and room dimensions in one view.
The figures shown describe this capture, including its app-reported floor estimate.

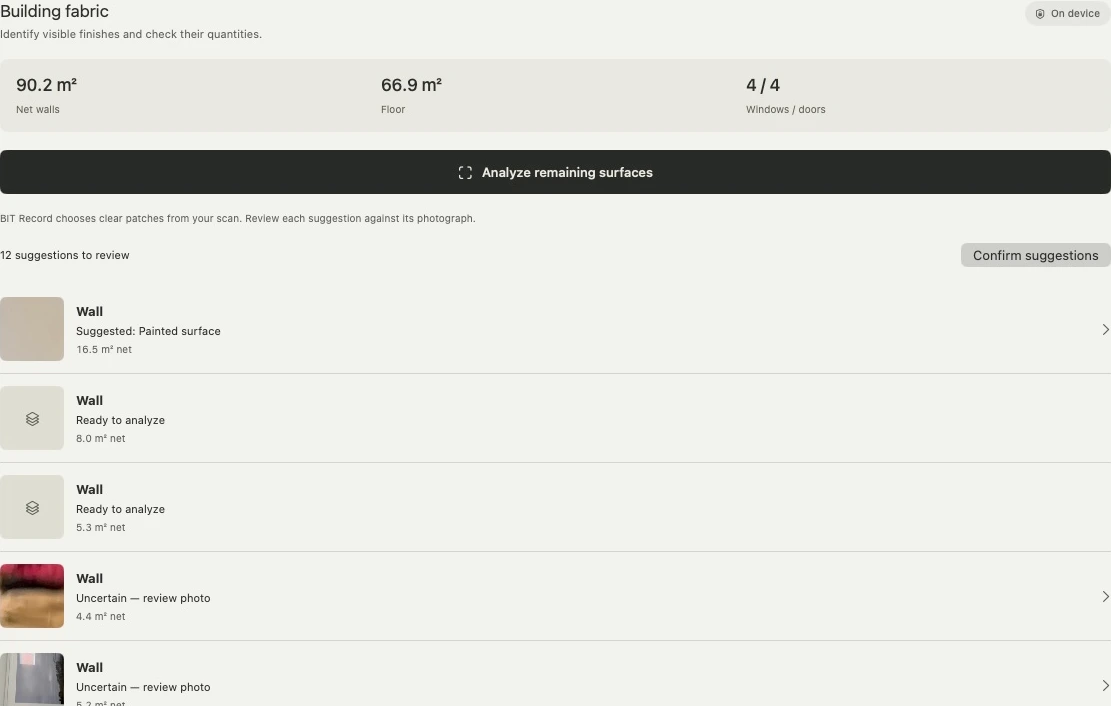
See how one capture can support your teams.
Discuss your portfolioEvidence / Assumptions / Sources
Know what sits
behind the figures.
BIT’s market budgets are notebook calculations using selected upgrade packages. Public data supplies the stock, performance and hazard inputs.
Data dates and scope
Analysis: 30 October 2026. EPC snapshot: 31 August 2026. Published figures use the notebook results extracted on 1 November 2026.
Housing estimates combine official borough stock totals with EPC rating shares by housing type. Business estimates use checked EPC identities and matched property areas.
The figures describe conditional works spending, not measured demand or financing eligibility. Modelled stock and generic package costs require building-level assessment before decisions.
Sources and definitions
- GLA · London Building Stock Model — housing shares and building stock context.
- Government · Energy Performance Certificates — ratings, areas and recorded assessments. EPC means Energy Performance Certificate.
- Government · Dwelling stock tables — borough housing totals.
- Government · Housing supply tables — gross new-home counts.
- Investment Property Forum · Energy-efficiency improvement costs — business package benchmark.
- ONS · Construction output price indices — price adjustment proxy.
- Environment Agency · Surface-water flood risk and rivers-and-sea flood risk — flood screening inputs.
- GLA · Properties vulnerable to heat impacts — heat context.
- Flood Re / JBA · Property flood-resilience costs — flood package assumptions.
Building Insights Together
Your portfolio.
Let’s look closer.
Talk to us about property-linked finance, building upgrades and BIT Record.
info@building-insights.org